Segmenting metrics by client
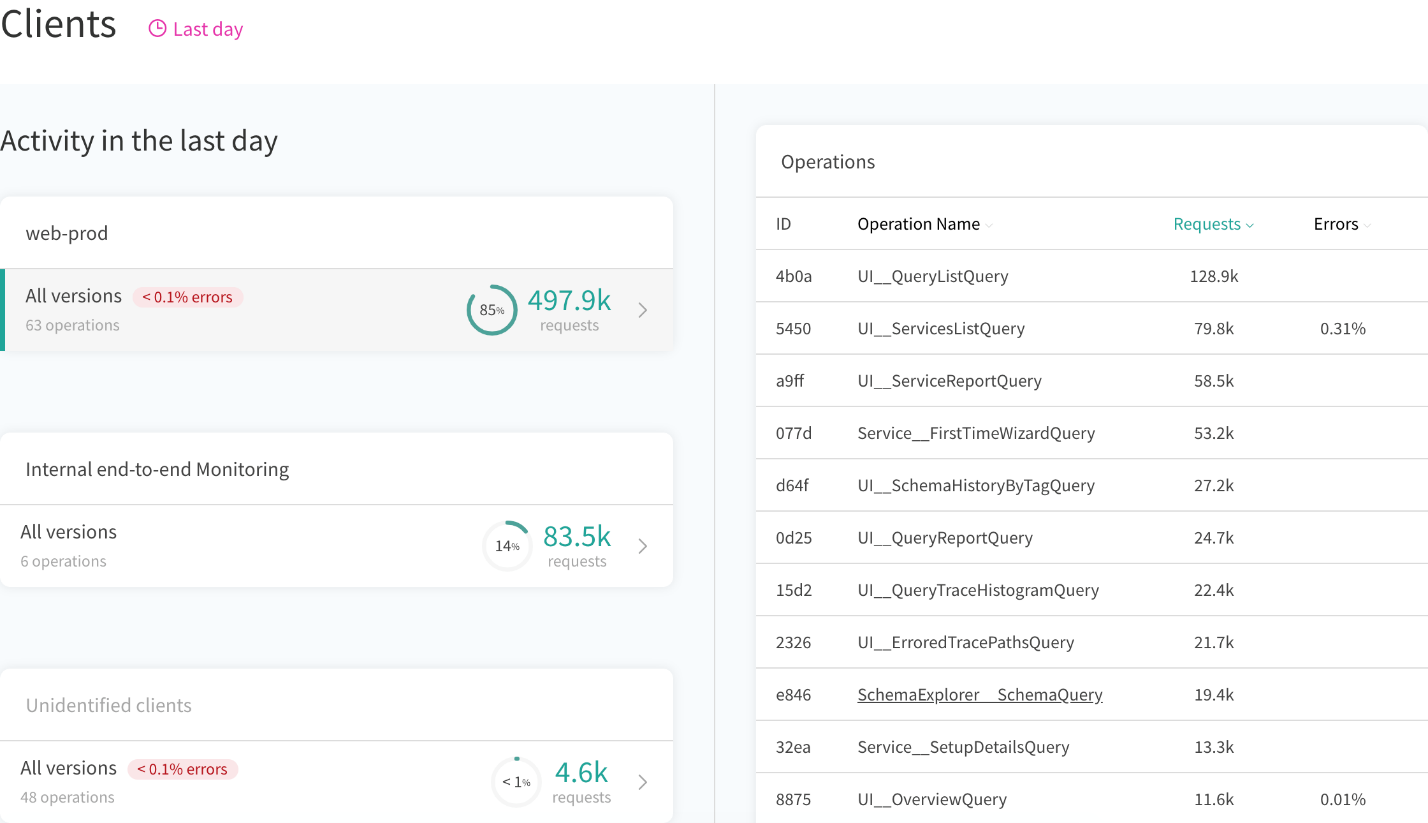
Apollo Graph Manager enables you to view operation metrics for each of your application's different clients (such as web and iOS) and client versions (such as 1.0 and 1.1), helping you understand how each one interacts with your data graph. This feature (called client awareness) is especially useful as your number of clients grows, and as you consider when to deprecate or discontinue support for older client versions.

Setup
First, make sure that your GraphQL server is already pushing analytics to Graph Manager.
Using Apollo Server and Apollo Client
By default, Apollo Server checks for the presence of the following HTTP headers in every incoming operation request:
- apollographql-client-name
- apollographql-client-version
If you're using Apollo Client, you can populate these headers automatically for every operation request by providing the name and version options to the ApolloClient constructor, like so:
import {ApolloClient } from 'apollo-client';
import {HttpLink } from 'apollo-link-http';

const client = new ApolloClient({
  link: new HttpLink({
    uri: 'http://localhost:4000/graphql'
  }),
  name: 'web',  version: '1.0'});
If one or both of these headers are present, Apollo Server automatically extracts their values and includes them in the trace report that it sends to Graph Manager.
Advanced Apollo Server configuration
You can configure Apollo Server to use a different method to determine the name and version of the client associated with a request. To do so, provide a generateClientInfo function to the ApolloServer constructor.
In the following example, the generateClientInfo function calls a userSuppliedLogic function, which can return values for the client's name and version based on the details of the request.
const { ApolloServer } = require("apollo-server");

const server = new ApolloServer({
  typeDefs,
  resolvers,
  engine: {
    apiKey: 'YOUR API KEY HERE',
    generateClientInfo: ({ request }) => {      const { clientName, clientVersion } = userSuppliedLogic(request);      return {        clientName,        clientVersion      };    }  }
});

server.listen().then(({ url }) => {
  console.log(`Server ready at ${url}`);
});
Common use cases
Diagnose client-specific issues
By filtering your data graph's metrics by client and client version, you can identify when a high failure rate for an operation is tied to a particular version. This helps you isolate the underlying cause of the failure and push an update for the affected client.
Deprecate, change, and remove fields safely
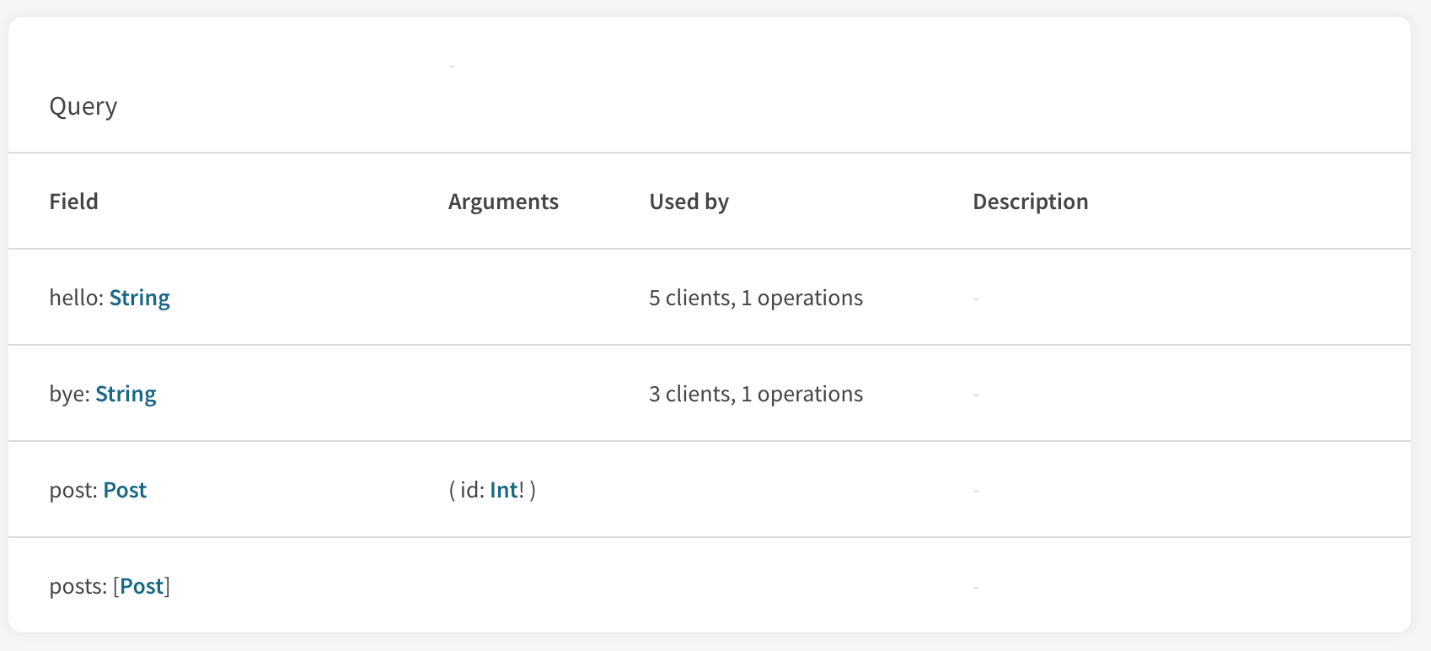
Modifying or removing an existing field in your schema is often a breaking change for the clients that use that field. Client awareness gives you a breakdown of which clients use which fields in your schema, enabling you to determine the impact of such a change:

Backend cutover
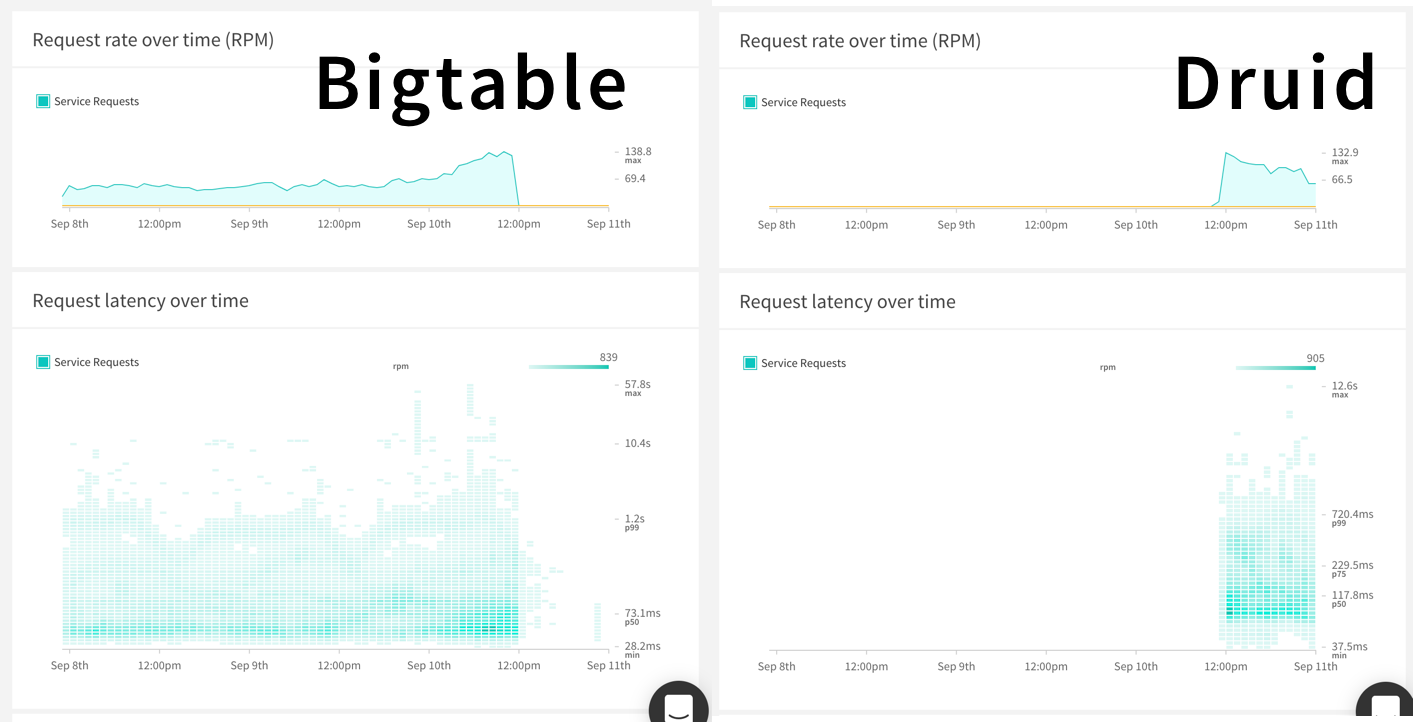
Changes to your schema often accompany changes to your backend, such as the addition of a new resolver, or even an entirely new data source. When you deploy a new version of your client that executes operations against these new resources, it's important to monitor operations to detect issues. Viewing metrics specific to the new client version helps you identify and resolve these issues quickly.
The following shows a cutover from one back-end service to another:

Previous:
Pushing trace data to Graph Manager
Next:
Analyzing performance
