Pandas Styling: Exercises, Practice, Solution
This resource offers a total of 75 Pandas Styling problems for practice. It includes 15 main exercises, each accompanied by solutions, detailed explanations, and four related problems.
Styling: This is a new feature and still under development. The styling is accomplished using CSS. You can write "style functions" that take scalars, DataFrames or Series, and return like-indexed DataFrames or Series with CSS "attribute: value" pairs for the values.
[An Editor is available at the bottom of the page to write and execute the scripts.]
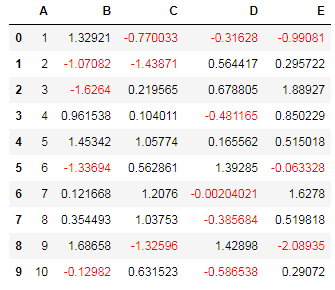
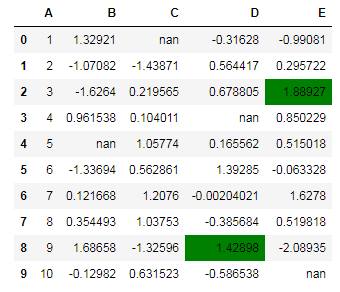
1. Highlight Negative/Positive Values
Create a dataframe of ten rows, four columns with random values. Write a Pandas program to highlight the negative numbers red and positive numbers black.
Expected Output:
Click me to see the sample solution
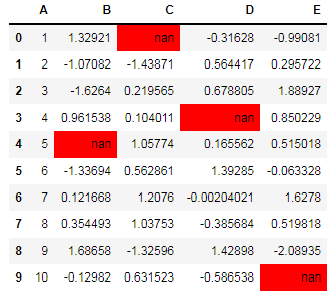
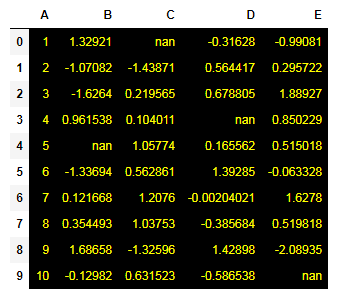
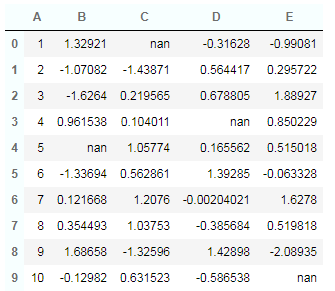
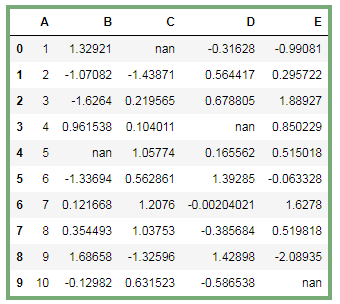
2. Highlight NaN Values
Create a dataframe of ten rows, four columns with random values. Convert some values to nan values. Write a Pandas program which will highlight the nan values.
Expected Output:
Click me to see the sample solution
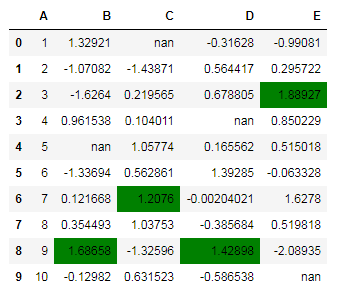
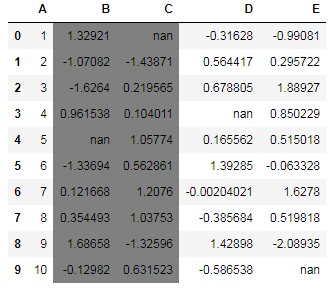
3. Highlight Maximum Value in Each Column
Create a dataframe of ten rows, four columns with random values. Write a Pandas program to highlight the maximum value in each column.
Expected Output:
Click me to see the sample solution
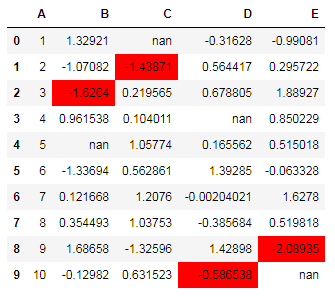
4. Highlight Minimum Value in Each Column
Create a dataframe of ten rows, four columns with random values. Write a Pandas program to highlight the minimum value in each column.
Expected Output:
Click me to see the sample solution
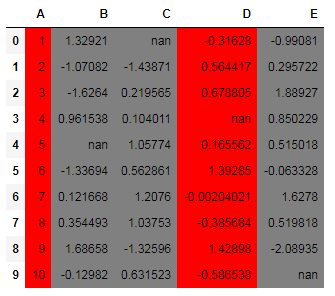
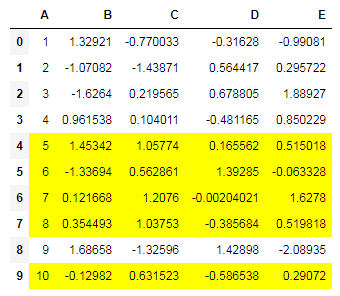
5. Highlight Maximum in Last Two Columns
Create a dataframe of ten rows, four columns with random values. Write a Pandas program to highlight the maximum value in last two columns.
Expected Output:
Click me to see the sample solution
6. Set DataFrame Background Black and Font Yellow
Create a dataframe of ten rows, four columns with random values. Write a Pandas program to set dataframe background Color black and font color yellow.
Expected Output:
Click me to see the sample solution
7. Highlight Specific Columns
Create a dataframe of ten rows, four columns with random values. Write a Pandas program to highlight dataframe's specific columns.
Expected Output:
Click me to see the sample solution
8. Highlight Specific Columns with Different Colors
Create a dataframe of ten rows, four columns with random values. Write a Pandas program to highlight dataframe's specific columns with different colors.
Expected Output:
Click me to see the sample solution
9. Display DataFrame in Table Style
Create a dataframe of ten rows, four columns with random values. Write a Pandas program to display the dataframe in table style.
Expected Output:
Click me to see the sample solution
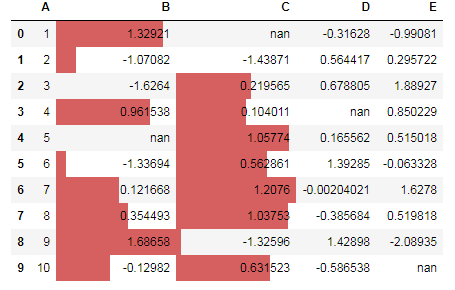
10. Highlight Entire Row Based on Condition
Create a dataframe of ten rows, four columns with random values. Write a Pandas program to highlight the entire row in Yellow where a specific column value is greater than 0.5.
Expected Output:
Click me to see the sample solution
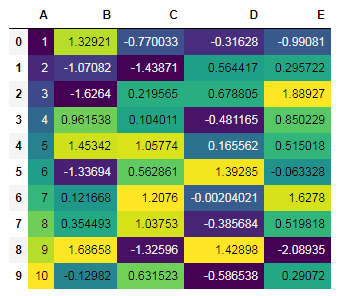
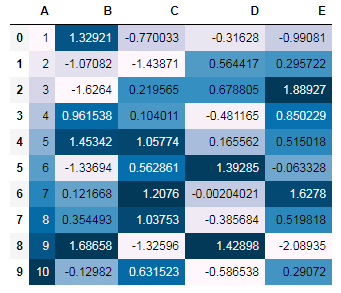
11. Display DataFrame in Heatmap Style
Create a dataframe of ten rows, four columns with random values. Write a Pandas program to display the dataframe in Heatmap style.
Expected Output:
Click me to see the sample solution
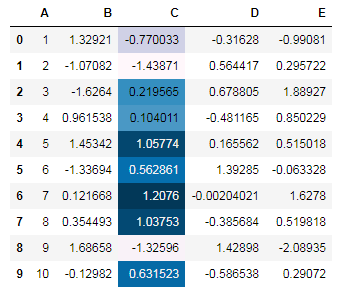
12. Gradient Color Mapping on a Specified Column
Create a dataframe of ten rows, four columns with random values. Write a Pandas program to make a gradient color mapping on a specified column.
Expected Output:
Click me to see the sample solution
13. Gradient Color on All Values
Create a dataframe of ten rows, four columns with random values. Write a Pandas program to make a gradient color on all the values of the said dataframe.
Expected Output:
Click me to see the sample solution
14. Display DataFrame in Table Style with Outer Border
Create a dataframe of ten rows, four columns with random values. Write a Pandas program to display the dataframe in table style and border around the table and not around the rows.
Expected Output:
Click me to see the sample solution
15. Display Bar Charts in DataFrame on Specified Columns
Create a dataframe of ten rows, four columns with random values. Write a Pandas program to display bar charts in dataframe on specified columns.
Expected Output:
Click me to see the sample solution
Python Code Editor:
More to Come !
Do not submit any solution of the above exercises at here, if you want to contribute go to the appropriate exercise page.
[ Want to contribute to Python Pandas exercises? Send your code (attached with a .zip file) to us at w3resource[at]yahoo[dot]com. Please avoid copyrighted materials.]
Test your Python skills with w3resource's quiz