Pandas styling Exercises: Write a Pandas program to highlight the entire row in Yellow where a specific column value is greater than 0.5
10. Highlight Entire Row Based on Condition
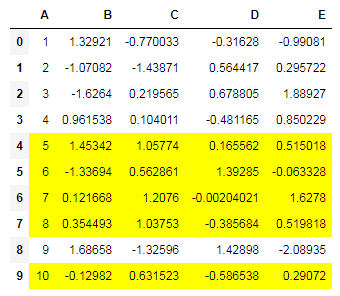
Create a dataframe of ten rows, four columns with random values. Write a Pandas program to highlight the entire row in Yellow where a specific column value is greater than 0.5.
Sample Solution :
Python Code :
import pandas as pd
import numpy as np
np.random.seed(24)
df = pd.DataFrame({'A': np.linspace(1, 10, 10)})
df = pd.concat([df, pd.DataFrame(np.random.randn(10, 4), columns=list('BCDE'))],
               axis=1)
print("Original array:")
print(df)
print("\nDataframe - table style:")

def highlight_greaterthan(x):
    if x.C > .5:
        return ['background-color: yellow']*5
    else:
        return ['background-color: white']*5
df.style.apply(highlight_greaterthan, axis=1)
Original array:
Original array:
      A         B         C         D         E
0   1.0  1.329212 -0.770033 -0.316280 -0.990810
1   2.0 -1.070816 -1.438713  0.564417  0.295722
2   3.0 -1.626404  0.219565  0.678805  1.889273
3   4.0  0.961538  0.104011 -0.481165  0.850229
4   5.0  1.453425  1.057737  0.165562  0.515018
5   6.0 -1.336936  0.562861  1.392855 -0.063328
6   7.0  0.121668  1.207603 -0.002040  1.627796
7   8.0  0.354493  1.037528 -0.385684  0.519818
8   9.0  1.686583 -1.325963  1.428984 -2.089354
9  10.0 -0.129820  0.631523 -0.586538  0.290720

Dataframe - table style:
Sample Output:
Download the Jupyter Notebook from here.
For more Practice: Solve these Related Problems:
- Write a Pandas program to highlight entire rows in a dataframe in yellow where a specific column’s value is greater than 0.5.
- Write a Pandas program to apply conditional row styling so that rows meeting a condition are rendered with a yellow background.
- Write a Pandas program to create a style function that checks a given column and highlights the corresponding row if its value exceeds 0.5.
- Write a Pandas program to dynamically highlight rows in a dataframe based on a threshold condition in one of the columns.
Go to:
PREV : Display DataFrame in Table Style.
NEXT : Display DataFrame in Heatmap Style.
Python Code Editor:
Have another way to solve this solution? Contribute your code (and comments) through Disqus.
What is the difficulty level of this exercise?