Pandas Series: plot.area() function
Series-plot.area() function
The plot.area() function is used to draw a stacked area plot.
An area plot displays quantitative data visually. This function wraps the matplotlib area function.
Syntax:
Series.plot.area(self, x=None, y=None, **kwargs)
Parameters:
| Name | Description | Type/Default Value | Required / Optional |
|---|---|---|---|
| x | Coordinates for the X axis. By default uses the index. | label or position | Optional |
| y | Column to plot. By default uses all columns. | label or position | Optional |
| stacked | Area plots are stacked by default. Set to False to create a unstacked plot. | bool, default True | Optional |
| **kwds | Additional keyword arguments are documented in DataFrame.plot(). | Optional |
Returns: matplotlib.axes.Axes or numpy.ndarray
Area plot, or array of area plots if subplots is True.
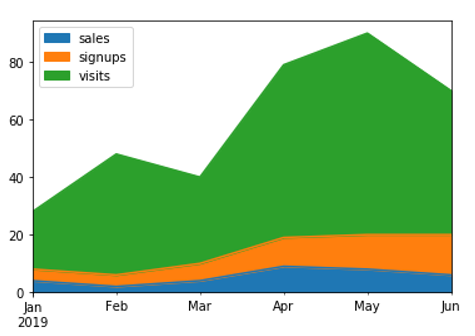
Example - Draw an area plot based on basic business metrics:
Python-Pandas Code:
import numpy as np
import pandas as pd
df = pd.DataFrame({
    'sales': [4, 2, 4, 9, 8, 6],
    'signups': [4, 4, 6, 10, 12, 14],
    'visits': [20, 42, 30, 60, 70, 50],
}, index=pd.date_range(start='2019/01/01', end='2019/07/01',
                       freq='M'))
ax = df.plot.area()
Output:
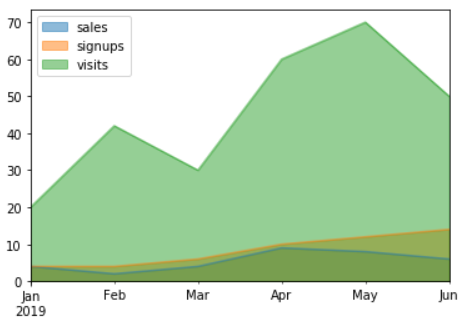
Example - Area plots are stacked by default. To produce an unstacked plot, pass stacked=False:
Python-Pandas Code:
import numpy as np
import pandas as pd
df = pd.DataFrame({
    'sales': [4, 2, 4, 9, 8, 6],
    'signups': [4, 4, 6, 10, 12, 14],
    'visits': [20, 42, 30, 60, 70, 50],
}, index=pd.date_range(start='2019/01/01', end='2019/07/01',
                       freq='M'))
ax = df.plot.area(stacked=False)
Output:
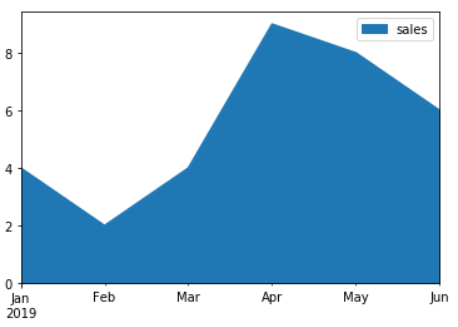
Example - Draw an area plot for a single column:
Python-Pandas Code:
import numpy as np
import pandas as pd
df = pd.DataFrame({
    'sales': [4, 2, 4, 9, 8, 6],
    'signups': [4, 4, 6, 10, 12, 14],
    'visits': [20, 42, 30, 60, 70, 50],
}, index=pd.date_range(start='2019/01/01', end='2019/07/01',
                       freq='M'))
ax = df.plot.area(y='sales')
Output:
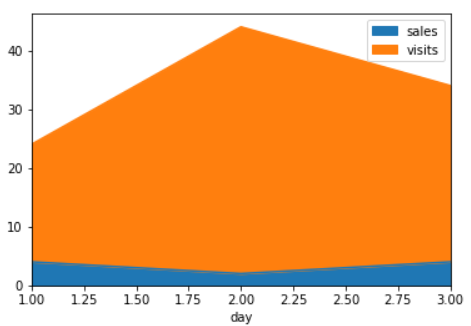
Example - Draw with a different x:
Python-Pandas Code:
import numpy as np
import pandas as pd
df = pd.DataFrame({
    'sales': [4, 2, 4],
    'visits': [20, 42, 30],
    'day': [1, 2, 3],
})
ax = df.plot.area(x='day')
Output:
PREV : Series-cat.rename_categories() function
NEXT : Series-plot.bar() function