Pandas Datetime: Create a heatmap for comparison of the top 10 years in which the UFO was sighted vs each Month
24. Heatmap for Top 10 UFO Years vs. Each Month
Write a Pandas program to create a heatmap (rectangular data as a color-encoded matrix) for comparison of the top 10 years in which the UFO was sighted vs each Month.
Sample Solution:
Python Code:
import pandas as pd
import matplotlib.pyplot as plt
import seaborn as sns
#Source: https://bit.ly/1l9yjm9
df = pd.read_csv(r'ufo.csv')
df['Date_time'] = df['Date_time'].astype('datetime64[ns]')
most_sightings_years = df['Date_time'].dt.year.value_counts().head(10)
def is_top_years(year):
   if year in most_sightings_years.index:
       return year
month_vs_year = df.pivot_table(columns=df['Date_time'].dt.month,index=df['Date_time'].dt.year.apply(is_top_years),aggfunc='count',values='city')
month_vs_year.columns = month_vs_year.columns.astype(int)
print("\nHeatmap for comparison of the top 10 years in which the UFO was sighted vs each month:")
plt.figure(figsize=(10,8))
ax = sns.heatmap(month_vs_year, vmin=0, vmax=4)
ax.set_xlabel('Month').set_size(20)
ax.set_ylabel('Year').set_size(20)
Sample Output:
Heatmap for comparison of the top 10 years in which the UFO was sighted vs each month: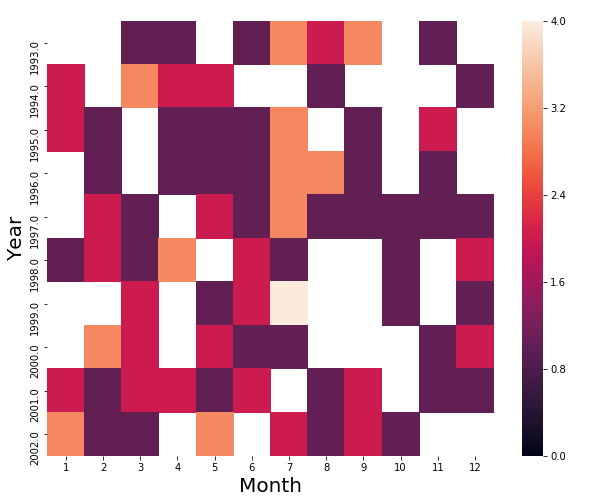
For more Practice: Solve these Related Problems:
- Write a Pandas program to create a heatmap that displays UFO sighting counts for each month across the top 10 years.
- Write a Pandas program to generate a pivot table for monthly UFO sightings for the top 10 years and plot it as a heatmap.
- Write a Pandas program to visualize the monthly distribution of UFO sightings for the top 10 years using a color-coded matrix.
- Write a Pandas program to build and display a heatmap from a pivot table comparing months versus the top 10 UFO sighting years.
Go to:
PREV : Top 10 UFO Years vs. Each Month.
NEXT : Timewheel: Hour vs. Year Comparison for Top 10 UFO Years.
Python Code Editor:
Have another way to solve this solution? Contribute your code (and comments) through Disqus.
What is the difficulty level of this exercise?