Creating a line graph with Python and Tkinter's canvas
Write a Python program that uses the Canvas widget to draw a line graph based on the provided data points using Tkinter.
Sample Solution:
Python Code:
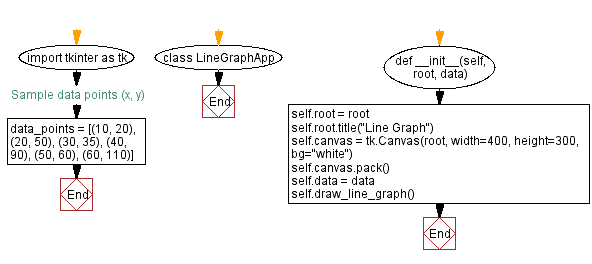
import tkinter as tk
# Sample data points (x, y)
data_points = [(10, 20), (20, 50), (30, 35), (40, 90), (50, 60), (60, 110)]
class LineGraphApp:
def __init__(self, root, data):
self.root = root
self.root.title("Line Graph")
self.canvas = tk.Canvas(root, width=400, height=300, bg="white")
self.canvas.pack()
self.data = data
self.draw_line_graph()
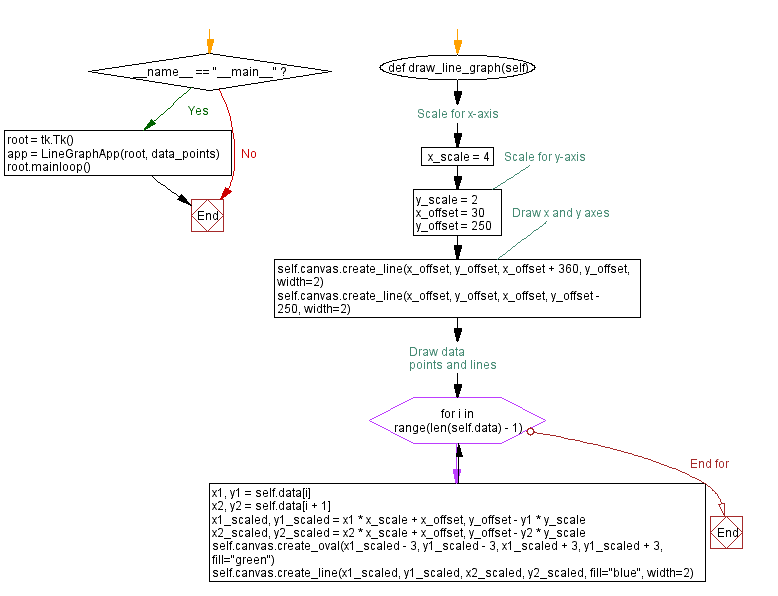
def draw_line_graph(self):
x_scale = 4 # Scale for x-axis
y_scale = 2 # Scale for y-axis
x_offset = 30
y_offset = 250
# Draw x and y axes
self.canvas.create_line(x_offset, y_offset, x_offset + 360, y_offset, width=2)
self.canvas.create_line(x_offset, y_offset, x_offset, y_offset - 250, width=2)
# Draw data points and lines
for i in range(len(self.data) - 1):
x1, y1 = self.data[i]
x2, y2 = self.data[i + 1]
x1_scaled, y1_scaled = x1 * x_scale + x_offset, y_offset - y1 * y_scale
x2_scaled, y2_scaled = x2 * x_scale + x_offset, y_offset - y2 * y_scale
self.canvas.create_oval(x1_scaled - 3, y1_scaled - 3, x1_scaled + 3, y1_scaled + 3, fill="green")
self.canvas.create_line(x1_scaled, y1_scaled, x2_scaled, y2_scaled, fill="blue", width=2)
if __name__ == "__main__":
root = tk.Tk()
app = LineGraphApp(root, data_points)
root.mainloop()
Explanation:
In the exercise above -
- Import the Tkinter library (tkinter).
- Define a "LineGraphApp" class to manage the line graph application.
- The "draw_line_graph()" method draws a line graph based on the provided data points.
- Scale the x and y values to fit the canvas and apply appropriate offsets.
- The x and y axes are drawn as well as data points and lines connecting them.
- Create a sample list of data points (data_points) to draw a line graph.
- The program sets up a Tkinter window with a canvas and calls the "draw_line_graph()" method to display the line graph.
- The main event loop, root.mainloop(), starts the Tkinter application.
Output:

Flowchart:
Go to:
Previous: Building a drawing program with Python and Tkinter.
Next: Building a whiteboard application with Python and Tkinter.
Python Code Editor:
What is the difficulty level of this exercise?
Test your Programming skills with w3resource's quiz.