Pandas: Create a plot of adjusted closing prices, thirty days simple moving average and exponential moving average
15. Plot with 30 Day SMA and Exponential Moving Average
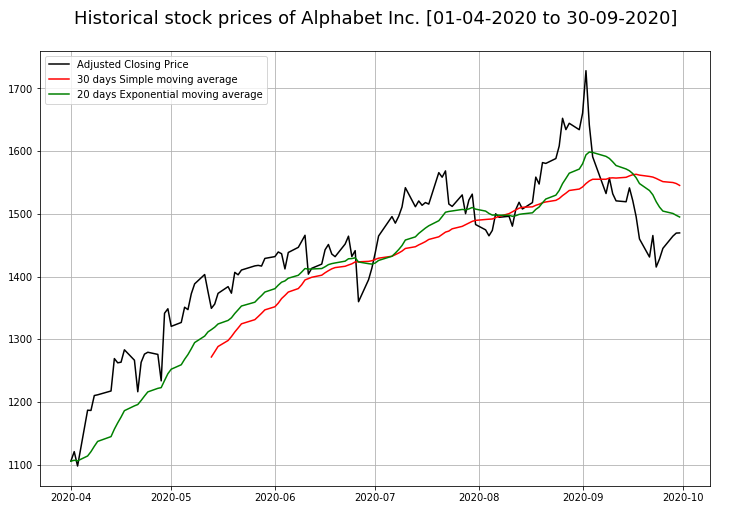
Write a Pandas program to create a plot of adjusted closing prices, 30 days simple moving average and exponential moving average of Alphabet Inc. between two specific dates.
Use the alphabet_stock_data.csv file to extract data.
What is Simple Moving Average (SMA)?
In financial applications a simple moving average (SMA) is the unweighted mean of the previous n data. However, in science and engineering, the mean is normally taken from an equal number of data on either side of a central value. This ensures that variations in the mean are aligned with the variations in the data rather than being shifted in time.
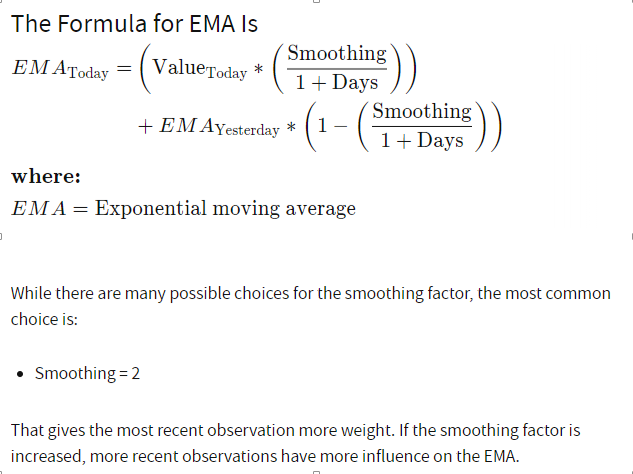
What Is an Exponential Moving Average (EMA)?
From investopedia.com - An exponential moving average (EMA) is a type of moving average (MA) that places a greater weight and significance on the most recent data points. The exponential moving average is also referred to as the exponentially weighted moving average. An exponentially weighted moving average reacts more significantly to recent price changes than a simple moving average (SMA), which applies an equal weight to all observations in the period.
alphabet_stock_data:
alphabet_stock_data Table
| Date | Open | High | Low | Close | Adj Close | Volume |
|---|---|---|---|---|---|---|
| 2020-04-01 | 1122 | 1129.689941 | 1097.449951 | 1105.619995 | 1105.619995 | 2343100 |
| 2020-04-02 | 1098.26001 | 1126.859985 | 1096.400024 | 1120.839966 | 1120.839966 | 1964900 |
| 2020-04-03 | 1119.015015 | 1123.540039 | 1079.810059 | 1097.880005 | 1097.880005 | 2313400 |
| 2020-04-06 | 1138 | 1194.660034 | 1130.939941 | 1186.920044 | 1186.920044 | 2664700 |
| ... | ... | ... | ... | ... | ... | ... |
| ... | ... | ... | ... | ... | ... | ... |
| 2020-09-29 | 1470.390015 | 1476.662964 | 1458.805054 | 1469.329956 | 1469.329956 | 978200 |
| 2020-09-30 | 1466.800049 | 1489.75 | 1459.880005 | 1469.599976 | 1469.599976 | 1700600 |
Sample Solution:
Python Code :
import pandas as pd
import matplotlib.pyplot as plt
df = pd.read_csv("alphabet_stock_data.csv")
start_date = pd.to_datetime('2020-4-1')
end_date = pd.to_datetime('2020-9-30')
df['Date'] = pd.to_datetime(df['Date'])
new_df = (df['Date']>= start_date) & (df['Date']<= end_date)
df1 = df.loc[new_df]
stock_data = df1.set_index('Date')
close_px = stock_data['Adj Close']
stock_data['SMA_30_days'] = stock_data.iloc[:,4].rolling(window=30).mean()
stock_data['EMA_20_days'] = stock_data.iloc[:,4].ewm(span=20,adjust=False).mean()
plt.figure(figsize=[15,10])
plt.grid(True)
plt.title('Historical stock prices of Alphabet Inc. [01-04-2020 to 30-09-2020]\n',fontsize=18, color='black')
plt.plot(stock_data['Adj Close'],label='Adjusted Closing Price', color='black')
plt.plot(stock_data['SMA_30_days'],label='30 days Simple moving average', color='red')
plt.plot(stock_data['EMA_20_days'],label='20 days Exponential moving average', color='green')
plt.legend(loc=2)
plt.show()
Sample Output:
Click for download alphabet_stock_data.csv
For more Practice: Solve these Related Problems:
- Write a Pandas program to plot the adjusted closing prices with both a 30-day simple moving average and an exponential moving average.
- Write a Pandas program to compute and plot the 30-day SMA and EMA on the same graph as the adjusted closing prices.
- Write a Pandas program to overlay the adjusted close price with its 30-day SMA and EMA, then compare their smoothing effects.
- Write a Pandas program to create a dual moving average plot that includes both the simple and exponential averages for trend analysis.
Go to:
PREV : Plot with 30 & 40 Day Simple Moving Averages.
NEXT : Scatter Plot: Trading Volume vs. Stock Prices.
Python Code Editor:
Have another way to solve this solution? Contribute your code (and comments) through Disqus.
What is the difficulty level of this exercise?
Test your Programming skills with w3resource's quiz.