Pandas: Create a plot of adjusted closing prices and simple moving average
14. Plot with 30 & 40 Day Simple Moving Averages
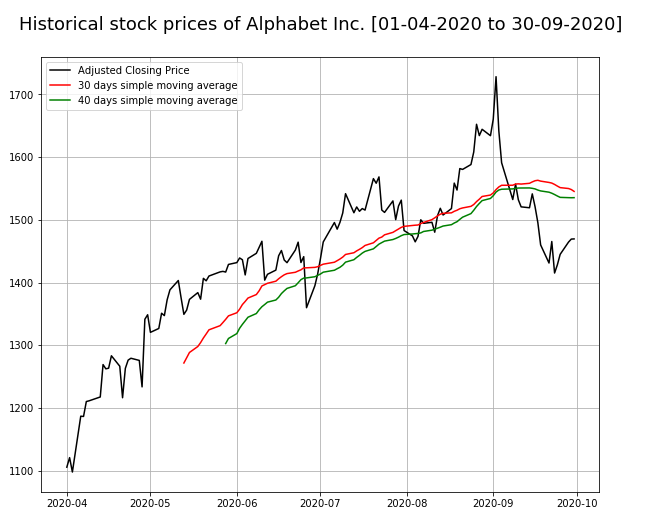
Write a Pandas program to create a plot of adjusted closing prices, thirty days and forty days simple moving average of Alphabet Inc. between two specific dates.
Use the alphabet_stock_data.csv file to extract data.
What Is Simple Moving Average (SMA)?
A simple moving average (SMA) is an arithmetic moving average calculated by adding recent prices and then dividing that figure by the number of time periods in the calculation average. For example, one could add the closing price of a security for a number of time periods and then divide this total by that same number of periods. Short-term averages respond quickly to changes in the price of the underlying security, while long-term averages are slower to react.
alphabet_stock_data:
alphabet_stock_data Table
| Date | Open | High | Low | Close | Adj Close | Volume |
|---|---|---|---|---|---|---|
| 2020-04-01 | 1122 | 1129.689941 | 1097.449951 | 1105.619995 | 1105.619995 | 2343100 |
| 2020-04-02 | 1098.26001 | 1126.859985 | 1096.400024 | 1120.839966 | 1120.839966 | 1964900 |
| 2020-04-03 | 1119.015015 | 1123.540039 | 1079.810059 | 1097.880005 | 1097.880005 | 2313400 |
| 2020-04-06 | 1138 | 1194.660034 | 1130.939941 | 1186.920044 | 1186.920044 | 2664700 |
| ... | ... | ... | ... | ... | ... | ... |
| ... | ... | ... | ... | ... | ... | ... |
| 2020-09-29 | 1470.390015 | 1476.662964 | 1458.805054 | 1469.329956 | 1469.329956 | 978200 |
| 2020-09-30 | 1466.800049 | 1489.75 | 1459.880005 | 1469.599976 | 1469.599976 | 1700600 |
Sample Solution:
Python Code :
import pandas as pd
import matplotlib.pyplot as plt
df = pd.read_csv("alphabet_stock_data.csv")
start_date = pd.to_datetime('2020-4-1')
end_date = pd.to_datetime('2020-9-30')
df['Date'] = pd.to_datetime(df['Date'])
new_df = (df['Date']>= start_date) & (df['Date']<= end_date)
df1 = df.loc[new_df]
stock_data = df1.set_index('Date')
close_px = stock_data['Adj Close']
stock_data['SMA_30_days'] = stock_data.iloc[:,4].rolling(window=30).mean()
stock_data['SMA_40_days'] = stock_data.iloc[:,4].rolling(window=40).mean()
plt.figure(figsize=[10,8])
plt.grid(True)
plt.title('Historical stock prices of Alphabet Inc. [01-04-2020 to 30-09-2020]\n',fontsize=18, color='black')
plt.plot(stock_data['Adj Close'],label='Adjusted Closing Price', color='black')
plt.plot(stock_data['SMA_30_days'],label='30 days simple moving average', color='red')
plt.plot(stock_data['SMA_40_days'],label='40 days simple moving average', color='green')
plt.legend(loc=2)
plt.show()
Sample Output:
Click for download alphabet_stock_data.csv
For more Practice: Solve these Related Problems:
- Write a Pandas program to plot the adjusted closing prices along with 30-day and 40-day simple moving averages over a specified period.
- Write a Pandas program to calculate and overlay two simple moving averages (30 and 40 days) on the adjusted close price plot.
- Write a Pandas program to create a line plot that shows the adjusted closing prices and their 30-day and 40-day moving averages, with clear legends.
- Write a Pandas program to generate a plot that compares the adjusted close price with two SMAs (30 & 40 days) and highlights crossover points.
Go to:
PREV : Plot of OHLC and Volume.
NEXT : Plot with 30 Day SMA and Exponential Moving Average.
Python Code Editor:
Have another way to solve this solution? Contribute your code (and comments) through Disqus.
What is the difficulty level of this exercise?
Test your Programming skills with w3resource's quiz.