Creating Multiple Line Plots in One Figure with Pandas
9. Multiple Line Plots in One Figure with Pandas
Write a Pandas program to plot multiple line plots in one figure with Pandas.
This exercise demonstrates how to plot multiple line plots in one figure using Pandas and Matplotlib.
Sample Solution :
Code :
import pandas as pd
import matplotlib.pyplot as plt

# Create a sample DataFrame
df = pd.DataFrame({
    'Year': [2017, 2018, 2019, 2020, 2021],
    'Product_A': [200, 250, 300, 350, 400],
    'Product_B': [150, 200, 250, 300, 350]
})

# Plot multiple lines for Product A and Product B
plt.plot(df['Year'], df['Product_A'], label='Product A', marker='o')
plt.plot(df['Year'], df['Product_B'], label='Product B', marker='s')

# Add labels and title
plt.xlabel('Year')
plt.ylabel('Sales')
plt.title('Sales of Product A and B Over Time')

# Add a legend
plt.legend()

# Display the plot
plt.show()
Output:
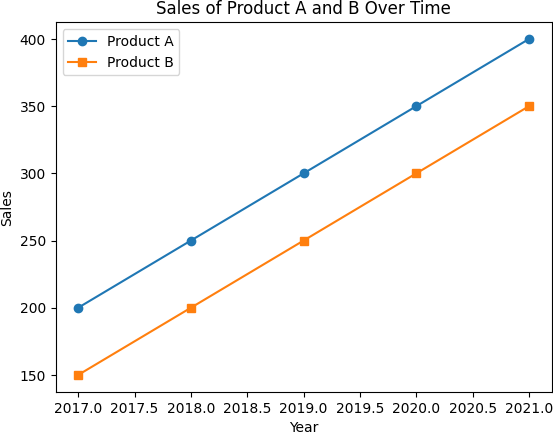
Explanation:
- Created a DataFrame with sales data for two products across different years.
- Plotted two line plots in the same figure for 'Product_A' and 'Product_B'.
- Added labels, a title, and a legend to the plot.
- Displayed the final plot.
For more Practice: Solve these Related Problems:
- Write a Pandas program to plot multiple line graphs from different DataFrame columns on the same figure using distinct styles.
- Write a Pandas program to create multiple line plots in one figure and add annotations at the peak values.
- Write a Pandas program to overlay multiple line plots and highlight the intersections between the lines.
- Write a Pandas program to generate multiple line plots with dual axes for different subsets of the DataFrame.
Go to:
PREV : Pie Chart using Pandas and Matplotlib.
NEXT : Grouped Bar Plot for Multiple Categories.
Python-Pandas Code Editor:
Have another way to solve this solution? Contribute your code (and comments) through Disqus.
What is the difficulty level of this exercise?
Test your Programming skills with w3resource's quiz.