Creating a Grouped Bar Plot for Multiple Categories Using Pandas
10. Grouped Bar Plot for Multiple Categories
Write a Pandas program to create a grouped bar plot for multiple categories.
This exercise shows how to create a grouped bar plot for multiple categories using Pandas and Matplotlib.
Sample Solution :
Code :
import pandas as pd
import matplotlib.pyplot as plt
# Create a sample DataFrame
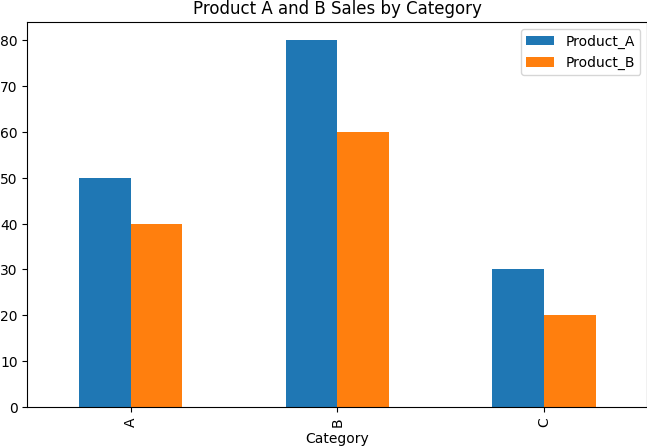
df = pd.DataFrame({
'Category': ['A', 'B', 'C'],
'Product_A': [50, 80, 30],
'Product_B': [40, 60, 20]
})
# Create a bar plot for multiple products
df.plot(kind='bar', x='Category', y=['Product_A', 'Product_B'], figsize=(8, 5))
# Add a title
plt.title('Product A and B Sales by Category')
# Display the plot
plt.show()
Output:
Explanation:
- Created a DataFrame with sales data for two products across different categories.
- Used plot(kind='bar') to create a grouped bar plot showing both 'Product_A' and 'Product_B' sales by category.
- Added a title and displayed the plot.
For more Practice: Solve these Related Problems:
- Write a Pandas program to create a grouped bar plot from a pivot table and customize the spacing between groups.
- Write a Pandas program to generate a grouped bar plot that compares average values across multiple categories.
- Write a Pandas program to create a grouped bar plot with error bars representing the standard deviation for each group.
- Write a Pandas program to produce a grouped bar plot and sort the groups based on a specific numeric metric.
Go to:
PREV : Multiple Line Plots in One Figure with Pandas.
NEXT : Pandas Styling Exercises Home.
Python-Pandas Code Editor:
Have another way to solve this solution? Contribute your code (and comments) through Disqus.
What is the difficulty level of this exercise?
Test your Programming skills with w3resource's quiz.