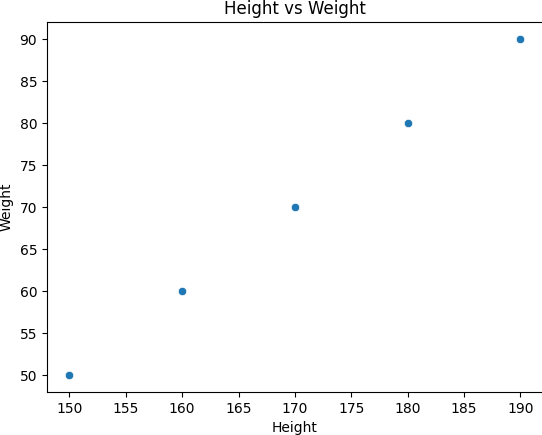
Creating a Scatter Plot with Pandas and Seaborn
5. Box Plot with Pandas and Seaborn
Write a Pandas program to create a Box Plot with Pandas and Seaborn.
This exercise creates a box plot to visualize the distribution and outliers in a dataset using Pandas and Seaborn.
Sample Solution :
Code :
import pandas as pd
import seaborn as sns
import matplotlib.pyplot as plt

# Create a sample DataFrame
df = pd.DataFrame({
    'Scores': [50, 55, 60, 65, 70, 75, 80, 85, 90, 100]
})

# Create a box plot of 'Scores'
sns.boxplot(y='Scores', data=df)

# Add a title
plt.title('Score Distribution Box Plot')

# Display the plot
plt.show()
Output:
Explanation:
- Created a DataFrame with 'Scores' data.
- Used sns.boxplot() to create a box plot that visualizes the distribution of scores and highlights any outliers.
- Added a title and displayed the plot.
For more Practice: Solve these Related Problems:
- Write a Pandas program to create a box plot grouped by a categorical column and display the outlier values.
- Write a Pandas program to create side-by-side box plots for multiple numerical columns in one figure.
- Write a Pandas program to generate a box plot with custom whisker lengths and different color codes for each group.
- Write a Pandas program to plot a box plot and overlay data points as a swarm plot using Seaborn.
Go to:
PREV : Histogram Plot with Pandas and Matplotlib.
NEXT : Pair Plot with Seaborn.
Python-Pandas Code Editor:
Have another way to solve this solution? Contribute your code (and comments) through Disqus.
What is the difficulty level of this exercise?
Test your Programming skills with w3resource's quiz.