Create a Basic Line Plot with Pandas and Matplotlib
1. Basic Line Plot with Pandas and Matplotlib
Write a Pandas program to draw a basic line plot with Pandas and Matplotlib.
This exercise demonstrates how to create a simple line plot using Pandas and Matplotlib.
Sample Solution :
Code :
import pandas as pd
import matplotlib.pyplot as plt
# Create a sample DataFrame
df = pd.DataFrame({
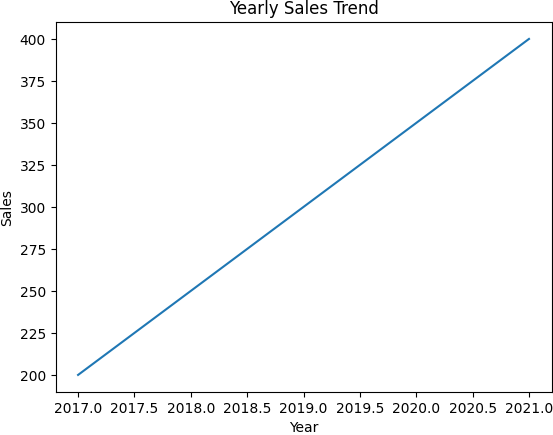
'Year': [2017, 2018, 2019, 2020, 2021],
'Sales': [200, 250, 300, 350, 400]
})
# Plot the 'Year' against 'Sales' using a line plot
plt.plot(df['Year'], df['Sales'])
# Add labels and a title
plt.xlabel('Year')
plt.ylabel('Sales')
plt.title('Yearly Sales Trend')
# Display the plot
plt.show()
Output:
Explanation:
- Created a sample DataFrame with 'Year' and 'Sales' columns.
- Used plt.plot() to plot 'Year' vs 'Sales'.
- Added axis labels and a title to the plot using plt.xlabel(), plt.ylabel(), and plt.title().
- Displayed the plot using plt.show().
For more Practice: Solve these Related Problems:
- Write a Pandas program to create a basic line plot for a DataFrame with a datetime index and multiple numerical columns.
- Write a Pandas program to draw a line plot showing the cumulative sum of a column with markers at specified intervals.
- Write a Pandas program to plot a rolling average over a specified window on a time series dataset using a line plot.
- Write a Pandas program to create a dual y-axis line plot for two different numerical columns on the same figure.
Go to:
PREV : Pandas Custom Functions Exercises Home.
NEXT : Bar Plot with Pandas and Matplotlib.
Python-Pandas Code Editor:
Have another way to solve this solution? Contribute your code (and comments) through Disqus.
What is the difficulty level of this exercise?
Test your Programming skills with w3resource's quiz.