Perform image processing tasks using SciPy's ndimage module
15. Image Processing with SciPy ndimage
Write a NumPy program to create a NumPy array and use SciPy's ndimage module to perform image processing tasks, such as filtering and edge detection.
Sample Solution:
Python Code:
import numpy as np # Import NumPy library
from scipy import ndimage # Import ndimage module from SciPy
import matplotlib.pyplot as plt # Import matplotlib for plotting
# Create a NumPy array representing a simple 2D image (e.g., a checkerboard pattern)
def create_checkerboard(size=8):
"""Create a checkerboard pattern."""
row_even = [1, 0] * size
row_odd = [0, 1] * size
board = []
for i in range(size):
if i % 2 == 0:
board.append(row_even)
else:
board.append(row_odd)
return np.array(board)
# Generate a checkerboard image
image = create_checkerboard(8)
# Apply Gaussian filter to the image
filtered_image = ndimage.gaussian_filter(image, sigma=1)
# Apply Sobel filter for edge detection
sobel_h = ndimage.sobel(image, axis=0) # Horizontal edges
sobel_v = ndimage.sobel(image, axis=1) # Vertical edges
sobel_combined = np.hypot(sobel_h, sobel_v) # Combine both directions
# Plot the original and processed images
plt.figure(figsize=(12, 8))
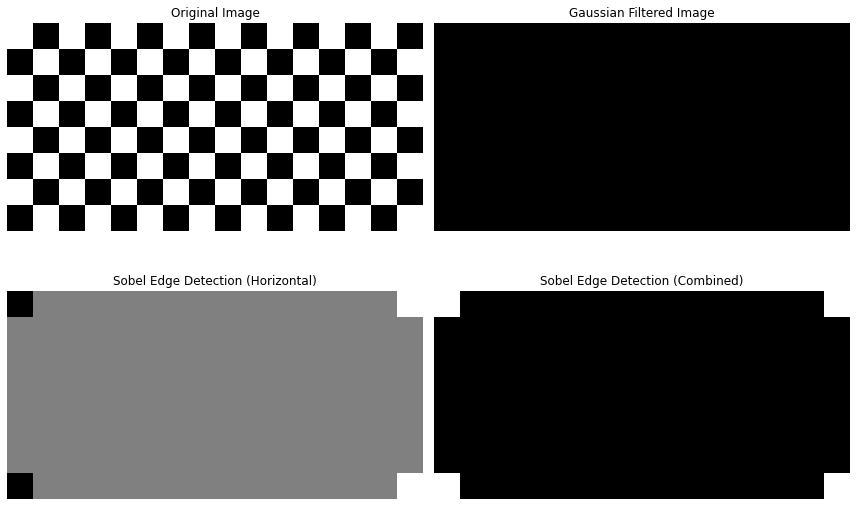
plt.subplot(2, 2, 1)
plt.title("Original Image")
plt.imshow(image, cmap='gray', interpolation='nearest')
plt.axis('off')
plt.subplot(2, 2, 2)
plt.title("Gaussian Filtered Image")
plt.imshow(filtered_image, cmap='gray', interpolation='nearest')
plt.axis('off')
plt.subplot(2, 2, 3)
plt.title("Sobel Edge Detection (Horizontal)")
plt.imshow(sobel_h, cmap='gray', interpolation='nearest')
plt.axis('off')
plt.subplot(2, 2, 4)
plt.title("Sobel Edge Detection (Combined)")
plt.imshow(sobel_combined, cmap='gray', interpolation='nearest')
plt.axis('off')
# Display the plots
plt.tight_layout()
plt.show()
Output:
Explanation:
- Import Libraries:
- Import the NumPy library for creating and manipulating arrays.
- Import the "ndimage" module from SciPy for image processing tasks.
- Import Matplotlib for plotting the images.
- Create a Checkerboard Pattern:
- Define a function create_checkerboard(size=8) to generate a checkerboard pattern as a 2D NumPy array.
- Use this function to create a sample image for processing.
- Apply Gaussian Filter:
- Use ndimage.gaussian_filter(image, sigma=1) to apply a Gaussian filter to the image. The sigma parameter controls the extent of the blurring.
- Apply Sobel Filter for Edge Detection:
- Use ndimage.sobel(image, axis=0) to detect horizontal edges in the image.
- Use ndimage.sobel(image, axis=1) to detect vertical edges in the image.
- Combine the horizontal and vertical edges using np.hypot(sobel_h, sobel_v) to create a comprehensive edge detection result.
- Plot the Original and Processed Images:
- Use Matplotlib to plot the original image, the Gaussian filtered image, the Sobel horizontal edges, and the combined Sobel edges in a 2x2 grid.
- Display the Plots:
- Use plt.tight_layout() to adjust the layout and plt.show() to display the plots.
For more Practice: Solve these Related Problems:
- Write a Numpy program to apply a Gaussian filter on an image array using SciPy's ndimage and then perform edge detection.
- Write a Numpy program to use SciPy's ndimage to perform image segmentation on a noisy image.
- Write a Numpy program to rotate an image by a specified angle using SciPy's ndimage.rotate and compare with manual interpolation.
- Write a Numpy program to apply a median filter on an image array with SciPy's ndimage.median_filter and assess the noise reduction.
Go to:
PREV : Optimization with SciPy's Optimize Module.
NEXT : Statistical Tests with SciPy Stats.
Python-Numpy Code Editor:
Have another way to solve this solution? Contribute your code (and comments) through Disqus.What is the difficulty level of this exercise?
Test your Programming skills with w3resource's quiz.