Perform Geometric transformations on Synthetic data with NumPy
18. Geometric Transformations with SciPy ndimage
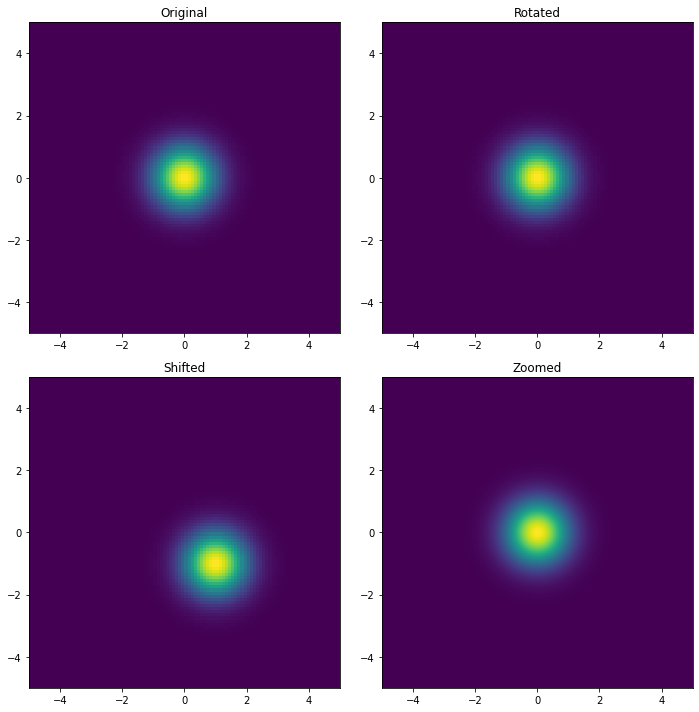
Write a Numpy program to generate a dataset and perform SciPy's ndimage geometric transformations (rotation, shift, zoom).
Sample Solution:
Python Code:
import numpy as np
import matplotlib.pyplot as plt
from scipy.ndimage import rotate, shift, zoom

# Generate a synthetic dataset: a 2D Gaussian blob
x = np.linspace(-5, 5, 100)
y = np.linspace(-5, 5, 100)
x, y = np.meshgrid(x, y)
z = np.exp(-(x**2 + y**2))

# Perform geometric transformations
# Rotation by 45 degrees
rotated_z = rotate(z, 45, reshape=False)

# Shift by 10 pixels along both axes
shifted_z = shift(z, shift=[10, 10])

# Zoom by a factor of 2
zoomed_z = zoom(z, zoom=2)

# Plot the original and transformed datasets
fig, axs = plt.subplots(2, 2, figsize=(10, 10))

# Original dataset
axs[0, 0].imshow(z, extent=[-5, 5, -5, 5])
axs[0, 0].set_title('Original')

# Rotated dataset
axs[0, 1].imshow(rotated_z, extent=[-5, 5, -5, 5])
axs[0, 1].set_title('Rotated')

# Shifted dataset
axs[1, 0].imshow(shifted_z, extent=[-5, 5, -5, 5])
axs[1, 0].set_title('Shifted')

# Zoomed dataset
axs[1, 1].imshow(zoomed_z, extent=[-5, 5, -5, 5])
axs[1, 1].set_title('Zoomed')

plt.tight_layout()
plt.show()
Output:
Explanation:
- Import libraries:
- Import necessary modules from NumPy, SciPy, and Matplotlib.
- Generate synthetic dataset:
- Create a 2D Gaussian blob using NumPy's meshgrid and exponential functions.
- Perform geometric transformations:
- Rotation: Rotate the dataset by 45 degrees using SciPy's rotate function.
- Shift: Shift the dataset by 10 pixels along both axes using SciPy's shift function.
- Zoom: Zoom into the dataset by a factor of 2 using SciPy's zoom function.
- Plot datasets:
- Use Matplotlib to visualize the original and transformed datasets in a 2x2 grid layout.
For more Practice: Solve these Related Problems:
- Write a Numpy program to apply a rotation transformation to an image array using SciPy's ndimage.rotate and verify the geometric distortion.
- Write a Numpy program to shift an image by a fractional number of pixels using SciPy's ndimage.shift.
- Write a Numpy program to zoom into a specific region of an image using SciPy's ndimage.zoom and compare with slicing.
- Write a Numpy program to perform a combination of rotation, shift, and zoom on an image array using SciPy's ndimage.affine_transform.
Go to:
PREV : Solving PDEs on a 2D Grid.
NEXT : Maximum Likelihood Estimation with SciPy Optimize.
Python-Numpy Code Editor:
Have another way to solve this solution? Contribute your code (and comments) through Disqus.What is the difficulty level of this exercise?
Test your Programming skills with w3resource's quiz.