Interpolate data points using NumPy and SciPy's Interpolate module
4. Interpolation with SciPy's Interpolate Module
Write a NumPy program to generate a set of data points using NumPy and perform interpolation using SciPy's interpolate module.
Sample Solution:
Python Code:
# Import necessary libraries
import numpy as np
from scipy import interpolate
import matplotlib.pyplot as plt
# Generate a set of data points using NumPy
x = np.linspace(0, 10, num=11, endpoint=True)
y = np.sin(x)
# Perform interpolation using SciPy's interpolate module
f = interpolate.interp1d(x, y, kind='cubic')
# Generate new x values for interpolation
x_new = np.linspace(0, 10, num=100, endpoint=True)
y_new = f(x_new)
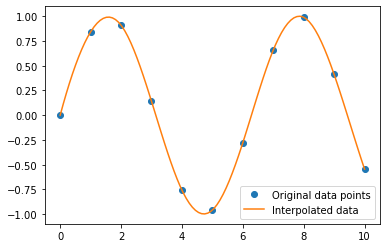
# Plot the original data points and the interpolated data
plt.plot(x, y, 'o', label='Original data points')
plt.plot(x_new, y_new, '-', label='Interpolated data')
plt.legend()
plt.show()
Output:
Explanation:
- Import necessary libraries:
- Import NumPy, SciPy's interpolate module, and Matplotlib for plotting.
- Generate a set of data points using NumPy:
- Create x values evenly spaced between 0 and 10, and corresponding y values using the sine function.
- Perform interpolation using SciPy's interpolate module:
- Use SciPy's interp1d function with cubic interpolation.
- Generate new x values for interpolation:
- Create a finer set of x values for smoother interpolation.
- Plot the original data points and the interpolated data:
- Use Matplotlib to visualize the original and interpolated data.
For more Practice: Solve these Related Problems:
- Write a Numpy program to generate irregularly spaced data points and perform cubic interpolation using SciPy.
- Write a Numpy program to interpolate missing values in a 1D dataset using SciPy's interp1d with various kinds of interpolation.
- Write a Numpy program to compare linear and spline interpolation on a noisy dataset using SciPy's interpolate module.
- Write a Numpy program to perform 2D interpolation on a grid of data points using SciPy's griddata function.
Go to:
PREV : Linear Algebra Operations with SciPy.
NEXT : Signal Processing on Time Series Data.
Python-Numpy Code Editor:
Have another way to solve this solution? Contribute your code (and comments) through Disqus.What is the difficulty level of this exercise?
Test your Programming skills with w3resource's quiz.