Generate random data and perform clustering using SciPy's Hierarchical clustering
11. Hierarchical Clustering with SciPy
Write a NumPy program to generate random data and perform clustering using SciPy's hierarchical clustering methods.
Sample Solution:
Python Code:
import numpy as np # Import NumPy library
from scipy.cluster.hierarchy import dendrogram, linkage, fcluster # Import hierarchical clustering functions
import matplotlib.pyplot as plt # Import matplotlib for plotting
# Generate random data
np.random.seed(0) # Seed for reproducibility
data = np.random.randn(50, 2) # Generate 50 2D points
# Perform hierarchical clustering using the linkage method
Z = linkage(data, method='ward')
# Create dendrogram plot
plt.figure(figsize=(10, 7))
dendrogram(Z)
plt.title("Dendrogram for Hierarchical Clustering")
plt.xlabel("Index")
plt.ylabel("Distance")
plt.show()
# Form flat clusters with a distance threshold
max_d = 1.5 # Maximum distance for clusters
clusters = fcluster(Z, max_d, criterion='distance')
# Print the cluster assignments
print("Cluster Assignments for Each Point:")
print(clusters)
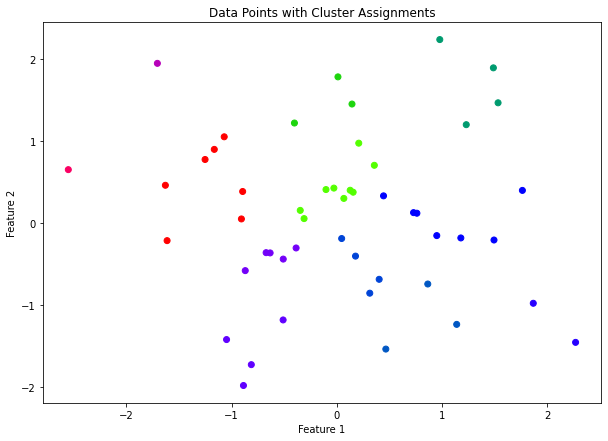
# Plot the data points with cluster assignments
plt.figure(figsize=(10, 7))
plt.scatter(data[:, 0], data[:, 1], c=clusters, cmap='prism')
plt.title("Data Points with Cluster Assignments")
plt.xlabel("Feature 1")
plt.ylabel("Feature 2")
plt.show()
Output:
Cluster Assignments for Each Point:
[ 7 10  6  7 12 11  7  7  7  8  2  9  6  8 10 12  5 12 10  4  5  3  4  1
  1  1  5 12 12  4  4  5  8  1  1  7  9  8  4 12  1  9 10  7  1 11 12 12
 11 12]
Explanation:
- Import Libraries:
- Import NumPy for generating random data.
- Import hierarchical clustering functions from SciPy: dendrogram, linkage, and fcluster.
- Import Matplotlib for plotting.
- Generate random data:
- Use np.random.seed(0) for reproducibility.
- Generate 50 random 2D points using np.random.randn(50, 2).
- Perform hierarchical clustering:
- Use the linkage method from SciPy with the 'ward' method to perform hierarchical clustering on the generated data.
- Create Dendrogram Plot:
- Use Matplotlib to create a dendrogram plot of the hierarchical clustering results. Label the x-axis as "Index" and the y-axis as "Distance".
- Form Flat Clusters:
- Use the fcluster function to form flat clusters based on a maximum distance threshold (max_d = 1.5).
- Print Cluster Assignments:
- Output the cluster assignments for each data point.
- Plot Data Points with Cluster Assignments:
- Use Matplotlib to create a scatter plot of the data points, coloring them based on their cluster assignments. Label the x-axis as "Feature 1" and the y-axis as "Feature 2".
For more Practice: Solve these Related Problems:
- Write a Numpy program to generate random data and perform agglomerative hierarchical clustering using SciPy's cluster hierarchy.
- Write a Numpy program to visualize the dendrogram of clustered data generated by SciPy's hierarchical clustering.
- Write a Numpy program to compute the cophenetic correlation coefficient of a hierarchical clustering solution using SciPy.
- Write a Numpy program to compare different linkage methods (e.g., single, complete, average) in hierarchical clustering using SciPy.
Go to:
PREV : Sparse Matrix Operations with SciPy.
NEXT : Distance Metrics Computation.
Python-Numpy Code Editor:
Have another way to solve this solution? Contribute your code (and comments) through Disqus.What is the difficulty level of this exercise?
Test your Programming skills with w3resource's quiz.