Fit a statistical model using MLE with NumPy and SciPy
19. Maximum Likelihood Estimation with SciPy Optimize
Write a NumPy program to generate a set of data and fit a statistical model using SciPy's optimize module for maximum likelihood estimation (MLE).
Sample Solution:
Python Code:
import numpy as np
from scipy.optimize import minimize
import matplotlib.pyplot as plt
# Generate synthetic data: sample from a normal distribution
np.random.seed(42)
data = np.random.normal(loc=5.0, scale=2.0, size=1000)
# Define the negative log-likelihood function for a normal distribution
def neg_log_likelihood(params):
mu, sigma = params
if sigma <= 0:
return np.inf
nll = -np.sum(np.log(1/(np.sqrt(2 * np.pi) * sigma) * np.exp(-(data - mu)**2 / (2 * sigma**2))))
return nll
# Initial guess for the parameters (mean and standard deviation)
initial_params = np.array([0.0, 1.0])
# Perform MLE using SciPy's minimize function
result = minimize(neg_log_likelihood, initial_params, method='L-BFGS-B', bounds=[(None, None), (1e-5, None)])
# Extract the estimated parameters
mu_mle, sigma_mle = result.x
# Print the results
print(f"Estimated mean (mu): {mu_mle:.3f}")
print(f"Estimated standard deviation (sigma): {sigma_mle:.3f}")
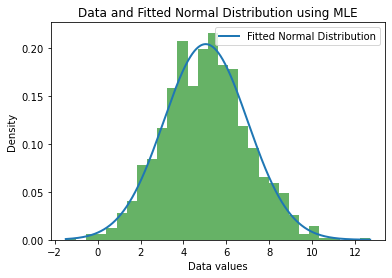
# Plot the data and the fitted normal distribution
plt.hist(data, bins=30, density=True, alpha=0.6, color='g')
# Plot the fitted normal distribution
x = np.linspace(min(data), max(data), 1000)
fitted_pdf = (1/(np.sqrt(2 * np.pi) * sigma_mle)) * np.exp(-(x - mu_mle)**2 / (2 * sigma_mle**2))
plt.plot(x, fitted_pdf, label='Fitted Normal Distribution', linewidth=2)
plt.xlabel('Data values')
plt.ylabel('Density')
plt.title('Data and Fitted Normal Distribution using MLE')
plt.legend()
plt.show()
Output:
Explanation:
- Import libraries:
- Import the necessary modules from NumPy, SciPy, and Matplotlib.
- Generate synthetic data:
- Create a sample dataset from a normal distribution using NumPy.
- Define the negative log-likelihood function:
- Define the function for the negative log-likelihood of a normal distribution.
- Initial guess:
- Provide an initial guess for the parameters (mean and standard deviation).
- Perform MLE:
- Use SciPy's minimize function with the L-BFGS-B method to find the parameters that minimize the negative log-likelihood.
- Extract parameters:
- Retrieve the estimated parameters (mean and standard deviation) from the result.
- Print results:
- Output the estimated parameters.
- Use Matplotlib to visualize the histogram of the data and the fitted normal distribution.
For more Practice: Solve these Related Problems:
- Write a Numpy program to generate a dataset from a known distribution and use SciPy's optimize.minimize to perform maximum likelihood estimation of its parameters.
- Write a Numpy program to fit a statistical model to data using SciPy's optimize module and compare the MLE results with method-of-moments estimates.
- Write a Numpy program to implement a custom log-likelihood function and optimize it with SciPy's optimize.minimize for parameter estimation.
- Write a Numpy program to perform maximum likelihood estimation on a dataset with outliers and compare the robustness of different loss functions using SciPy.
Go to:
PREV : Geometric Transformations with SciPy ndimage.
NEXT : NumPy Advanced Exercises.
Python-Numpy Code Editor:
Have another way to solve this solution? Contribute your code (and comments) through Disqus.What is the difficulty level of this exercise?
Test your Programming skills with w3resource's quiz.