Fit a curve to sample data using NumPy and SciPy's curve_fit
6. Curve Fitting with SciPy's curve_fit
Write a NumPy program to create a set of sample data and fit a curve using SciPy's curve_fit function.
Sample Solution:
Python Code:
# Import necessary libraries
import numpy as np
from scipy.optimize import curve_fit
import matplotlib.pyplot as plt
# Create a set of sample data using NumPy
np.random.seed(0) # For reproducibility
x = np.linspace(0, 10, 100)
y = 2.5 * np.sin(1.5 * x) + np.random.normal(size=x.size)
# Define the model function to be fitted
def model_func(x, a, b):
return a * np.sin(b * x)
# Use SciPy's curve_fit function to fit the model to the data
params, covariance = curve_fit(model_func, x, y)
# Extract the fitted parameters
a_fit, b_fit = params
# Generate y values using the fitted parameters
y_fit = model_func(x, a_fit, b_fit)
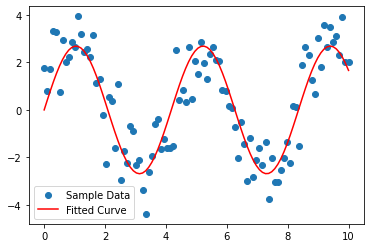
# Plot the original data and the fitted curve
plt.scatter(x, y, label='Sample Data')
plt.plot(x, y_fit, label='Fitted Curve', color='red')
plt.legend()
plt.show()
Output:
Explanation:
- Import necessary libraries:
- Import NumPy, SciPy's curve_fit function, and Matplotlib for plotting.
- Create a set of sample data using NumPy:
- Generate x values evenly spaced between 0 and 10, and corresponding y values using a sine function with added noise.
- Define the model function to be fitted:
- Create a sine function model with parameters a and b.
- Use SciPy's curve_fit function to fit the model to the data:
- Fit the model function to the data to determine the best-fit parameters.
- Extract the fitted parameters:
- Retrieve the parameters a and b from the fitting process.
- Generate y values using the fitted parameters:
- Use the fitted parameters to generate the y values.
- Plot the original data and the fitted curve:
- Use Matplotlib to visualize the sample data and the fitted curve.
For more Practice: Solve these Related Problems:
- Write a Numpy program to generate noisy data points and fit them to an exponential model using SciPy's curve_fit.
- Write a Numpy program to fit a polynomial curve to a dataset and then evaluate the goodness-of-fit metrics.
- Write a Numpy program to compare curve_fit results for different model functions on the same synthetic dataset.
- Write a Numpy program to fit a sinusoidal model to periodic data using SciPy's curve_fit and plot the fitted curve over the data.
Go to:
PREV : Signal Processing on Time Series Data.
NEXT : Hypothesis Testing with SciPy Stats.
Python-Numpy Code Editor:
Have another way to solve this solution? Contribute your code (and comments) through Disqus.What is the difficulty level of this exercise?
Test your Programming skills with w3resource's quiz.