Filter Time Series data using NumPy and SciPy Signal processing
5. Signal Processing on Time Series Data
Write a NumPy program to create a time series dataset and apply SciPy's signal processing functions to filter the data.
Sample Solution:
Python Code:
# Import necessary libraries
import numpy as np
from scipy import signal
import matplotlib.pyplot as plt
# Create a time series dataset using NumPy
np.random.seed(0) # For reproducibility
time = np.linspace(0, 1, 500, endpoint=False)
data = np.sin(2 * np.pi * 7 * time) + np.random.randn(500) * 0.5
# Design a Butterworth filter using SciPy
b, a = signal.butter(4, 0.1)
# Apply the filter to the time series data
filtered_data = signal.filtfilt(b, a, data)
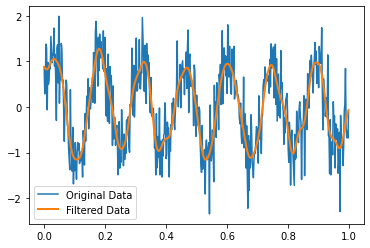
# Plot the original and filtered data
plt.plot(time, data, label='Original Data')
plt.plot(time, filtered_data, label='Filtered Data', linewidth=2)
plt.legend()
plt.show()
Output:
Explanation:
- Import necessary libraries:
- Import NumPy, SciPy's signal module, and Matplotlib for plotting.
- Create a time series dataset using NumPy:
- Generate time series data consisting of a sine wave with added noise.
- Design a Butterworth filter using SciPy:
- Use SciPy's butter function to design a low-pass Butterworth filter.
- Apply the filter to the time series data:
- Use SciPy's "filtfilt()" function to apply the filter, ensuring zero phase distortion.
- Plot the original and filtered data:
- Use Matplotlib to visualize both the original noisy data and the filtered data.
For more Practice: Solve these Related Problems:
- Write a Numpy program to generate a synthetic time series and apply a low-pass filter using SciPy's signal module.
- Write a Numpy program to simulate a noisy signal and remove noise using a band-stop filter from SciPy's signal processing tools.
- Write a Numpy program to compute and plot the frequency response of a filter designed with SciPy's signal module.
- Write a Numpy program to design and apply a digital filter on a time series, then compare the filtered output with the original signal.
Go to:
PREV : Interpolation with SciPy's Interpolate Module.
NEXT : Fit a Curve Fitting with SciPy's curve_fit.
Python-Numpy Code Editor:
Have another way to solve this solution? Contribute your code (and comments) through Disqus.What is the difficulty level of this exercise?
Test your Programming skills with w3resource's quiz.