NumPy: Compute the x and y coordinates for points on a sine curve and plot the points using matplotlib
Sine Curve Coordinates with Plot
Write a NumPy program to compute the x and y coordinates for points on a sine curve and plot the points using matplotlib.
This problem involves writing a NumPy program to compute the x and y coordinates for points on a sine curve and then plot these points using Matplotlib. The task requires generating a range of x values and computing the corresponding y values using NumPy's sine function. The program then uses Matplotlib to visualize the sine curve by plotting the calculated points, demonstrating how to combine NumPy and Matplotlib for mathematical computations and data visualization.
Sample Solution :
Python Code :
# Importing the NumPy library with an alias 'np'
import numpy as np

# Importing the pyplot module from matplotlib with an alias 'plt'
import matplotlib.pyplot as plt

# Compute the x coordinates from 0 to 3*pi with a step of 0.2
x = np.arange(0, 3 * np.pi, 0.2)

# Compute the y coordinates by applying the sine function to each x value
y = np.sin(x)

# Printing a message indicating the plot is created using Matplotlib
print("Plot the points using matplotlib:")

# Plotting the x and y coordinates using Matplotlib's plot function
plt.plot(x, y)

# Displaying the plot
plt.show()
Output:
Explanation:
In the above code -
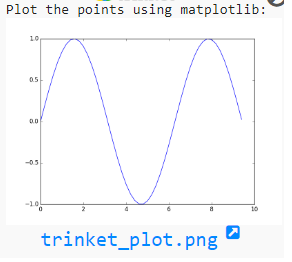
The np.arange(0, 3 * np.pi, 0.2) statement creates a 1D NumPy array and stores in the variable 'x' with values ranging from 0 to 3π (inclusive of 0 and exclusive of 3π), in increments of 0.2. These values will be used as the x-coordinates for the sine wave.
The y = np.sin(x) statement computes the sine of each element in the 'x' array and creates a new NumPy array named 'y' containing the corresponding y-coordinates for the sine wave.
plt.plot(x, y) statement uses Matplotlib's 'plot()' function to create a 2D line plot with 'x' as the x-coordinates and 'y' as the y-coordinates. It generates the sine wave plot without displaying it yet.
plt.show() statement uses Matplotlib's 'show()' function to display the created sine wave plot in a separate window.
For more Practice: Solve these Related Problems:
- Compute sine and cosine values over a given range and plot both curves using matplotlib.
- Generate sine wave data points, apply a phase shift, and then plot the modified curve.
- Plot a sine curve and clearly mark its peaks and troughs on the graph.
- Create a sine curve plot and overlay a line plot of its first derivative for comparison.
Go to:
PREV : List to Array to List Comparison
NEXT : Convert NumPy Dtypes to Python Types
Python-Numpy Code Editor:
Have another way to solve this solution? Contribute your code (and comments) through Disqus.What is the difficulty level of this exercise?
Test your Programming skills with w3resource's quiz.