Mastering numpy.meshgrid for Grid-based Computations
Comprehensive Guide to numpy.meshgrid in Python
numpy.meshgrid is a versatile NumPy function used to create coordinate grids from one-dimensional coordinate arrays. It is widely used in mathematical computations, plotting, and simulations, where grid-like data is essential.
Syntax:
numpy.meshgrid(*xi, indexing='xy', sparse=False, copy=True)
Parameters:
- xi (array-like): 1-D arrays representing the grid coordinates along each dimension.
- indexing (str, optional): Specifies Cartesian ('xy', default) or matrix ('ij') indexing.
- sparse (bool, optional): If True, generates sparse output arrays for memory efficiency. Default is False.
- copy (bool, optional): If True, returns copies of the input arrays. Default is True.
Returns:
- X1, X2, ..., XN (ndarrays): N-dimensional coordinate matrices.
Examples:
Example 1: Basic Usage with Cartesian Indexing
Code:
import numpy as np

# Define 1D arrays for x and y coordinates
x = np.array([1, 2, 3])
y = np.array([4, 5])

# Create 2D coordinate grids
X, Y = np.meshgrid(x, y)

# Print the grids
print("X Grid:\n", X)
print("Y Grid:\n", Y)
Output:
X Grid:
 [[1 2 3]
 [1 2 3]]
Y Grid:
 [[4 4 4]
 [5 5 5]]
Explanation:
- The x and y arrays are combined to form grids.
- The X grid repeats the x values row-wise, and the Y grid repeats the y values column-wise.
Example 2: Using Matrix Indexing
Code:
import numpy as np

# Define 1D arrays
x = np.array([1, 2, 3])
y = np.array([4, 5])

# Create grids with matrix indexing
X, Y = np.meshgrid(x, y, indexing='ij')

# Print the grids
print("X Grid:\n", X)
print("Y Grid:\n", Y)
Output:
X Grid:
 [[1 1]
 [2 2]
 [3 3]]
Y Grid:
 [[4 5]
 [4 5]
 [4 5]]
Explanation:
Matrix indexing ('ij') creates grids where:
- X repeats x values column-wise.
- Y repeats y values row-wise.
Example 3: Sparse Grids for Memory Efficiency
Code:
import numpy as np

# Define 1D arrays
x = np.linspace(0, 5, 3)  # 3 points from 0 to 5
y = np.linspace(10, 20, 4)  # 4 points from 10 to 20

# Create sparse grids
X, Y = np.meshgrid(x, y, sparse=True)

# Print the grids
print("X Grid:\n", X)
print("Y Grid:\n", Y)
Output:
X Grid:
 [[0.  2.5 5. ]]
Y Grid:
 [[10.        ]
 [13.33333333]
 [16.66666667]
 [20.        ]]
Explanation:
Sparse grids reduce memory usage by only storing unique coordinate values. The resulting grids can still be used in computations but consume less memory.
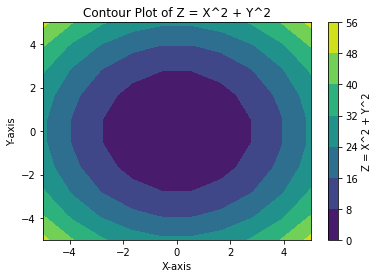
Example 4: Visualizing Grids
Code:
import numpy as np
import matplotlib.pyplot as plt

# Define coordinate arrays
x = np.linspace(-5, 5, 10)
y = np.linspace(-5, 5, 10)

# Create grids
X, Y = np.meshgrid(x, y)

# Compute a function (e.g., Z = X^2 + Y^2)
Z = X**2 + Y**2

# Plot the grid
plt.contourf(X, Y, Z, cmap='viridis')
plt.colorbar(label='Z = X^2 + Y^2')
plt.title('Contour Plot of Z = X^2 + Y^2')
plt.xlabel('X-axis')
plt.ylabel('Y-axis')
plt.show()
Output:

Explanation:
Grids created using numpy.meshgrid can be visualized to analyze spatial relationships or functions like Z = X^2 + Y^2.
Additional Notes:
- Applications: Often used in numerical simulations, 3D visualizations, and evaluation of multivariable functions.
- Performance Tip: Use sparse=True for high-dimensional grids to save memory.
- Indexing Modes:
- 'xy' (default): Cartesian-style grids, common in plotting.
- 'ij': Matrix-style grids, common in multi-dimensional indexing.
