Matplotlib Scatter: Draw a scatter plot comparing two subject marks of Mathematics and Science
Matplotlib Scatter: Exercise-4 with Solution
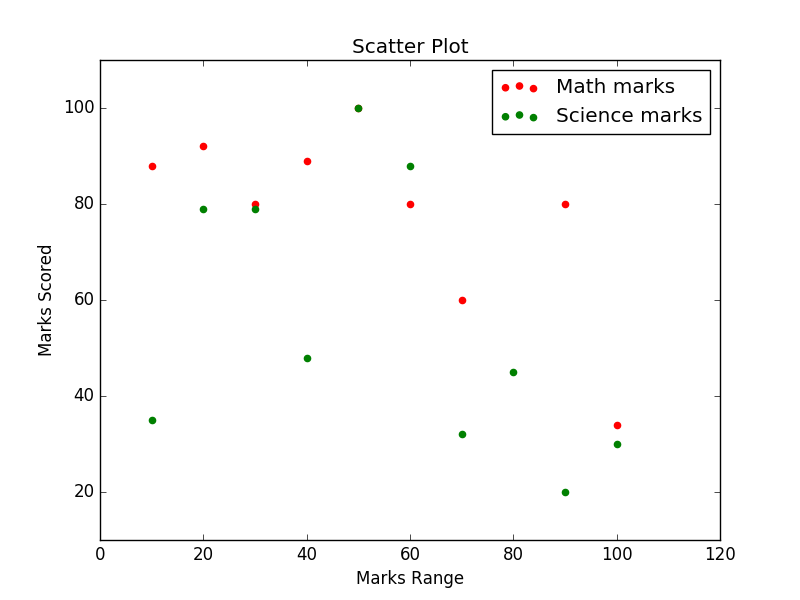
Write a Python program to draw a scatter plot comparing two subject marks of Mathematics and Science. Use marks of 10 students.
Test Data:
math_marks = [88, 92, 80, 89, 100, 80, 60, 100, 80, 34]
science_marks = [35, 79, 79, 48, 100, 88, 32, 45, 20, 30]
marks_range = [10, 20, 30, 40, 50, 60, 70, 80, 90, 100]
Sample Solution:
Python Code:
import matplotlib.pyplot as plt
import pandas as pd
math_marks = [88, 92, 80, 89, 100, 80, 60, 100, 80, 34]
science_marks = [35, 79, 79, 48, 100, 88, 32, 45, 20, 30]
marks_range = [10, 20, 30, 40, 50, 60, 70, 80, 90, 100]
plt.scatter(marks_range, math_marks, label='Math marks', color='r')
plt.scatter(marks_range, science_marks, label='Science marks', color='g')
plt.title('Scatter Plot')
plt.xlabel('Marks Range')
plt.ylabel('Marks Scored')
plt.legend()
plt.show()
Sample Output:

Go to:
PREV : Write a Python program to draw a scatter plot using random distributions to generate balls of different sizes.
NEXT : Write a Python program to draw a scatter plot for three different groups comparing weights and heights.
Python Code Editor:
Contribute your code and comments through Disqus.
What is the difficulty level of this exercise?
