Matplotlib Scatter: Draw a scatter plot using random distributions to generate balls of different sizes
Matplotlib Scatter: Exercise-3 with Solution
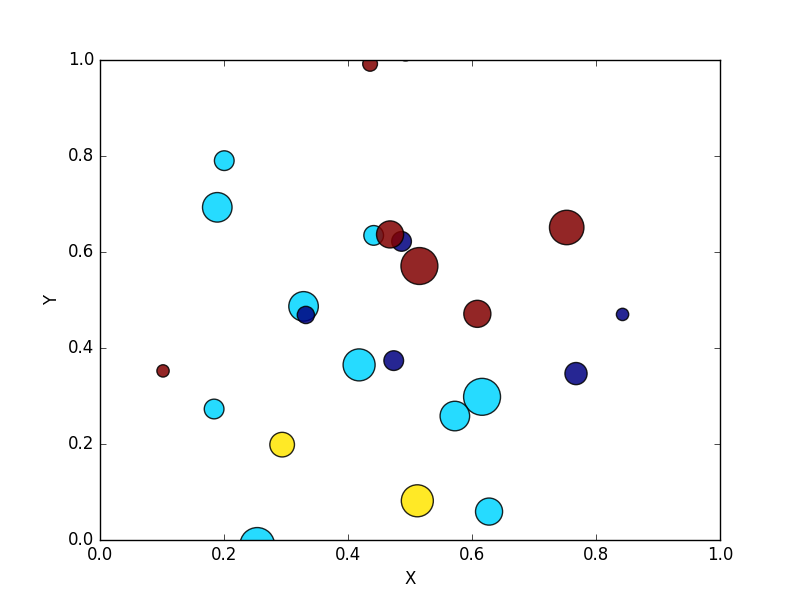
Write a Python program to draw a scatter plot using random distributions to generate balls of different sizes.
Sample Solution:
Python Code:
import math
import random
import matplotlib.pyplot as plt
# create random data
no_of_balls = 25
x = [random.triangular() for i in range(no_of_balls)]
y = [random.gauss(0.5, 0.25) for i in range(no_of_balls)]
colors = [random.randint(1, 4) for i in range(no_of_balls)]
areas = [math.pi * random.randint(5, 15)**2 for i in range(no_of_balls)]
# draw the plot
plt.figure()
plt.scatter(x, y, s=areas, c=colors, alpha=0.85)
plt.axis([0.0, 1.0, 0.0, 1.0])
plt.xlabel("X")
plt.ylabel("Y")
plt.show()
Sample Output:
Go to:
PREV : Write a Python program to draw a scatter plot with empty circles taking a random distribution in X and Y and plotted against each other.
NEXT : Write a Python program to draw a scatter plot comparing two subject marks of Mathematics and Science. Use marks of 10 students.
Python Code Editor:
Contribute your code and comments through Disqus.
What is the difficulty level of this exercise?