Matplotlib Basic: Plot two or more lines on same plot with suitable legends of each line
Matplotlib Basic: Exercise-5 with Solution
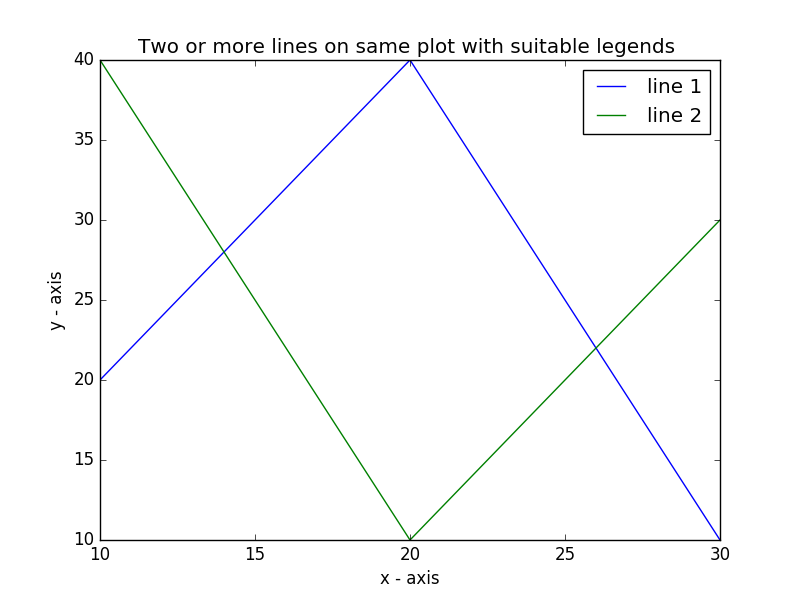
Write a Python program to plot two or more lines on same plot with suitable legends of each line.
Sample Solution:
Python Code:
import matplotlib.pyplot as plt
# line 1 points
x1 = [10,20,30]
y1 = [20,40,10]
# plotting the line 1 points
plt.plot(x1, y1, label = "line 1")
# line 2 points
x2 = [10,20,30]
y2 = [40,10,30]
# plotting the line 2 points
plt.plot(x2, y2, label = "line 2")
plt.xlabel('x - axis')
# Set the y axis label of the current axis.
plt.ylabel('y - axis')
# Set a title of the current axes.
plt.title('Two or more lines on same plot with suitable legends ')
# show a legend on the plot
plt.legend()
# Display a figure.
plt.show()
Sample Output:

Go to:
PREV : Write a Python program to draw line charts of the financial data of Alphabet Inc. between October 3, 2016 to October 7, 2016.
NEXT : Write a Python program to plot two or more lines with legends, different widths and colors.
Python Code Editor:
Contribute your code and comments through Disqus.
What is the difficulty level of this exercise?
