Matplotlib Bar Chart: Display textures to bars and wedges
Matplotlib Bar Chart: Exercise-17 with Solution
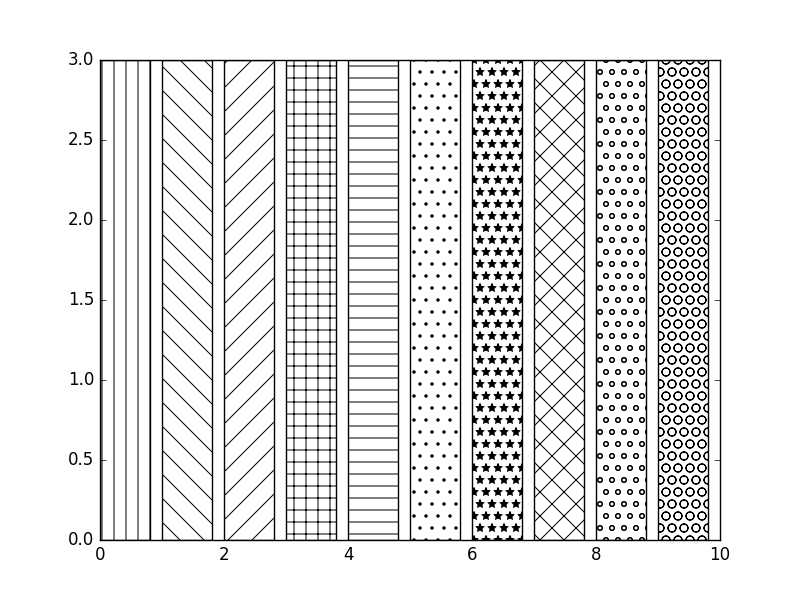
Write a Python program to add textures (black and white) to bars and wedges.
Sample Solution:
Python Code:
import matplotlib.pyplot as plt
fig = plt.figure()
patterns = [ "|" , "\\" , "/" , "+" , "-", ".", "*","x", "o", "O" ]

ax = fig.add_subplot(111)
for i in range(len(patterns)):
    ax.bar(i, 3, color='white', edgecolor='black', hatch=patterns[i])

plt.show()
Sample Output:
Go to:
PREV : Write a Python program to create stack bar plot and add label to each section.
NEXT :
Matplotlib Pie Chart Exercises
Python Code Editor:
Have another way to solve this solution? Contribute your code (and comments) through Disqus.
What is the difficulty level of this exercise?