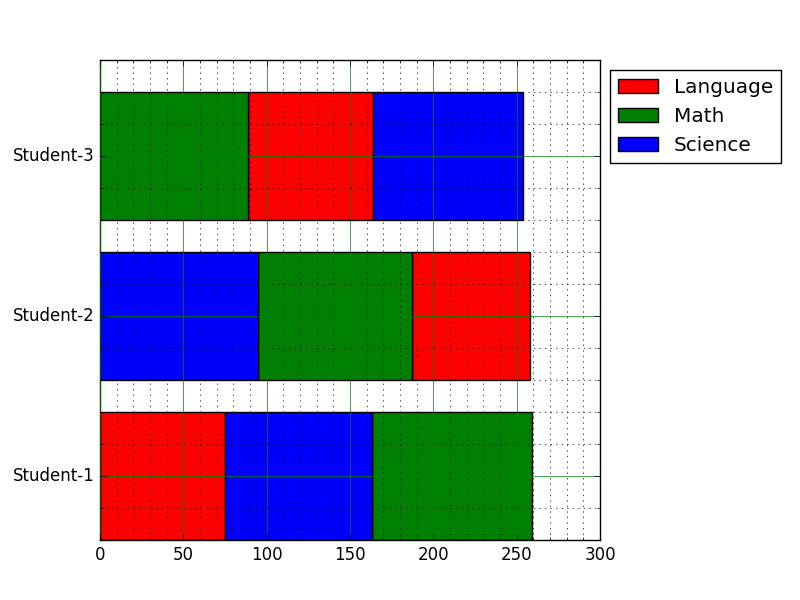
Matplotlib Bar Chart: Create a horizontal bar chart with differently ordered colors
Matplotlib Bar Chart: Exercise-15 with Solution
Write a Python program to create a horizontal bar chart with differently ordered colors.
Note: Use bottom to stack the women’s bars on top of the men’s bars.
Sample Data Set:
languages = [['Language','Science','Math'],
['Science','Math','Language'],
['Math','Language','Science']]
numbers = [{'Language':75, 'Science':88, 'Math':96},
{'Language':71, 'Science':95, 'Math':92},
{'Language':75, 'Science':90, 'Math':89}]
Sample Solution:
Python Code:
import numpy as np
from matplotlib import pyplot as plt

num_set = [{'Language':75, 'Science':88, 'Math':96},
           {'Language':71, 'Science':95, 'Math':92},
           {'Language':75, 'Science':90, 'Math':89}]

lan_guage    = [['Language','Science','Math'],
               ['Science','Math','Language'],
               ['Math','Language','Science']]
colors = ["r","g","b"]
names = sorted(num_set[0].keys())
values = np.array([[data[name] for name in order] for data,order in zip(num_set, lan_guage)])
lefts = np.insert(np.cumsum(values, axis=1),0,0, axis=1)[:, :-1]
orders = np.array(lan_guage)
bottoms = np.arange(len(lan_guage))

for name, color in zip(names, colors):
	idx = np.where(orders == name)
	value = values[idx]
	left = lefts[idx]
	plt.bar(left=left, height=0.8, width=value, bottom=bottoms,
	color=color, orientation="horizontal", label=name)
plt.yticks(bottoms+0.4, ["Student-%d" % (t+1) for t in bottoms])
plt.legend(loc="best", bbox_to_anchor=(1.0, 1.00))
plt.subplots_adjust(right=0.75)
# Turn on the grid
plt.minorticks_on()
plt.grid(which='major', linestyle='-', linewidth='0.5', color='green')
plt.grid(which='minor', linestyle=':', linewidth='0.5', color='black')

plt.show()
Sample Output:

Go to:
PREV : Write a Python program to create a stacked bar plot with error bars.
NEXT :
Write a Python program to create stack bar plot and add label to each section.
Python Code Editor:
Contribute your code and comments through Disqus.
What is the difficulty level of this exercise?
